[av_one_full first min_height=” vertical_alignment=” space=” custom_margin=” margin=’0px’ padding=’0px’ border=” border_color=” radius=’0px’ background_color=” src=” background_position=’top left’ background_repeat=’no-repeat’ animation=”]
[av_heading heading=’Map shows Iloilo City brgys prone to natural hazards’ tag=’h3′ style=’blockquote modern-quote’ size=” subheading_active=’subheading_below’ subheading_size=’15’ padding=’10’ color=” custom_font=”][/av_heading]
[av_textblock size=” font_color=’custom’ color=’#0a0a0a’]
Friday, February 24, 2017
[/av_textblock]
[av_image src=’http://www.panaynews.net/wp-content/uploads/2017/02/region-hazard-map-591×321.jpg’ attachment=’97689′ attachment_size=’entry_with_sidebar’ align=’center’ styling=” hover=” link=” target=” caption=’yes’ font_size=’14’ appearance=’on-hover’ overlay_opacity=’0.4′ overlay_color=’#000000′ overlay_text_color=’#ffffff’ animation=’no-animation’]
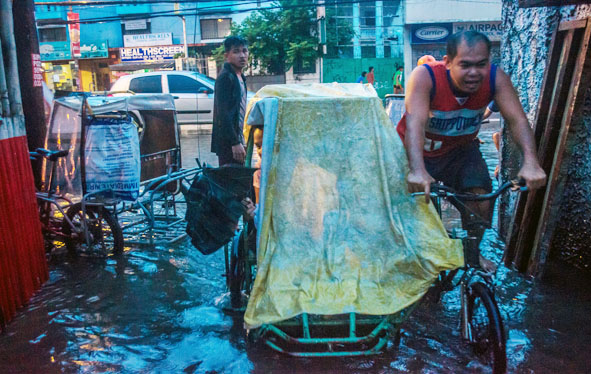
Floodwater makes its way through a narrow pathway, an inconvenience residents of Barangay San Nicolas, La Paz, Iloilo City have to put up with during heavy downpour, in this Nov. 25, 2016 photo. IAN PAUL CORDERO/PN
[/av_image]
[av_textblock size=” font_color=’custom’ color=’#0a0a0a’]
ILOILO City – A map showing barangays vulnerable to climate change-induced hazards has been turned over to the local government.
The Hydrological and Meteorological Map of Iloilo City was crafted under the Be Secure Project of the United States Agency for International Development.
City Planning and Development Office coordinator Jose Roni J. Peñalosa accompanied former Environment secretary and now Be Secure Project leader Elisea Gozon during the turnover on Wednesday.
Aside from showing villages prone to typhoon, flood, sea-level rise, drought, and strong wind, the analytical map indicates coastal barangays set to experience increased rainfall in the next years until 2040, Peñalosa said.
The map also shows the increasing temperatures that coastal areas may experience due to heat from the ocean.
In creating the map, the state weather bureau Pagasa and the Manila Observatory partnered with Be Secure Project to generate simulations and projections of climate change, said Peñalosa.
A hydrological and meteorological map is not new to the city, he said.
In 2013, UN Habitat also conducted vulnerability and adaptation assessment for barangays after Mayor Jed Patrick Mabilog sought its aid in preparing for disasters.
After a year, UN Habitat sent city hall a report showing similar hydro-meteorological data.
According to Peñalosa, the updated map will affect planning, especially on maximizing the city government’s resources.
It will guide the local government as it prepares to update its Comprehensive Land Use Plan, Comprehensive Development Plan, Local Climate Change Action Plan, and Disaster Risk Reduction and Management Plan.
“Hazard data change every now and then because, while we can forecast, you can never tell exactly if [the hazards] will happen or not,” said Peñalosa. “What we have today are more recent figures and statistics. These data are very relevant to more appropriate interventions.”
The map will be explained in detail to barangay leaders on March 2. “If this will be communicated to our barangays, they would be able to prioritize their spending,” he said. (PNA)
[/av_textblock]
[/av_one_full]


